
I Built an Embedded Mock Tool
I recently built a small tool called embedded-mock-tools. To be completely honest, 100% of the coding was done by AI. I just kept telling it what I wanted, and judging by the result, it understood those requirements pretty well.
Simply put, it is a Mock panel that can be embedded directly into a page. Load a devtools-panel.js file and a floating button appears. Open it to see the request list, request details, and the Mock rule editor. It can intercept both fetch and XMLHttpRequest, and with a Service Worker, mocked requests can also show up in the browser’s native Network panel.
Flowchart

Why I Built It
Mocking APIs is neither new nor difficult, and there are already plenty of tools for it. The annoying part is that I often only want to verify one page state, yet getting there requires a long detour.
For example:
- The API is not ready, but the page still needs to be built
- I want to check an empty list, a 500 response, a timeout, or missing fields
- Test data exists today, but someone may change it tomorrow
- I do not fully control the project, so changing the proxy or starting another service is inconvenient
- The page may only be a demo or embedded in another system, and setting up a full Mock Server for it feels excessive
- Mixing mocked and real requests through a Mock Server can get awkward
There are a few common ways to deal with this. One is to temporarily put something like this in the application code:
1 | if (IS_MOCK) { |
This is the fastest option, but also the easiest thing to forget to remove. Another option is a proxy tool or a Mock Server. That is more formal, but it means configuring routes, starting a service, and keeping the rules in sync. If all I want is to quickly inspect one UI state, it feels a little heavy.
So I wanted something simpler: let the Mock tool travel with the page. As long as the page can load a script, I can inspect requests and change responses.
1 | <script src="./devtools-panel.js"></script> |
That is enough.
Why Not Chrome Overrides?
I do have something to say about Chrome Overrides, because I used it for a long time. Before that, I also used HTTP interception tools such as Charles, mostly for packet inspection. While building this tool, I naturally thought about Local Overrides in Chrome DevTools: what does it not handle well, and what could this tool add?
Chrome Overrides can replace local web resources and HTTP response headers, and it can modify the response body of XHR and fetch requests. The advantage is obvious: no application code changes and no extra service. Right-click a request in DevTools, choose Override content, and edit the response. For many situations, that is already enough.
For example:
- Temporarily change an API response, even on a production page, and see whether the UI behaves correctly
- Replace a static resource such as CSS, JavaScript, or HTML
- Debug response headers such as CORS or Permissions-Policy locally
- Keep changes across refreshes without touching the project code
But a few parts of it do not quite fit the problems I wanted to solve:
There Is Only a Global Switch
The Chrome Overrides switch lives in the Sources panel. For URLs with override files, everything is either on or off. There is no straightforward way to enable only one override. I can delete the overrides I do not need, but then I have to recreate them the next time I want them.
Rules Are Not Easy to Reuse
Chrome Overrides feels more like saving the response of one request as a local file. That works well for a specific resource, but it is less obvious when I want to maintain a set of Mock rules organized by method, URL pattern, status code, delay, and headers. embedded-mock-tools keeps them as a rule list, and each rule can have an alias that is immediately visible in the Mock Rules panel.
1 | { |
To me, this looks and behaves more like actual Mock configuration.
It Is Not That Simple to Hand Off
Chrome Overrides is a browser feature, which is perfectly fine when I am debugging by myself. But if I send a demo to someone else, they also need to open DevTools, choose an Overrides directory, grant file access, and save the corresponding override files. That may be fine for another developer, but it becomes inconvenient for product managers, QA engineers, or anyone unfamiliar with DevTools. embedded-mock-tools takes the opposite approach: embed the tool in the page, and the panel is ready as soon as the other person opens it.
State Transitions Are Awkward
Some APIs do not return one fixed JSON response. I may also be developing a feature several steps deep while still wanting to run through the entire flow during development. Saving those responses as a Snapshot lets me develop and debug in a way that follows both my intuition and the final user flow.
Its Relationship with the Project Is Different
Chrome Overrides is personal browser configuration, so it is better suited to temporary debugging. embedded-mock-tools is closer to a development helper that belongs to the project. It can be committed with a demo or test page, and a set of Mock rules can be shared through JSON import and export. They are not really replacements for each other.
This is roughly how I choose between them:
| Scenario | Choice |
|---|---|
| Temporarily replace a file on a production page | Chrome Overrides |
| Temporarily change one API response | Chrome Overrides |
| Maintain a set of Mock rules | embedded-mock-tools |
| Give someone a demo that works immediately | embedded-mock-tools |
| Replay several API responses in sequence | embedded-mock-tools |
| Debug response headers | Chrome Overrides or embedded-mock-tools |
Chrome Overrides is more like an advanced DevTools feature. embedded-mock-tools is more of an in-project development tool.
Features
Request List
The left side of the panel contains a live request list. It shows the request method, URL, status code, duration, request headers and body, and response headers and body.
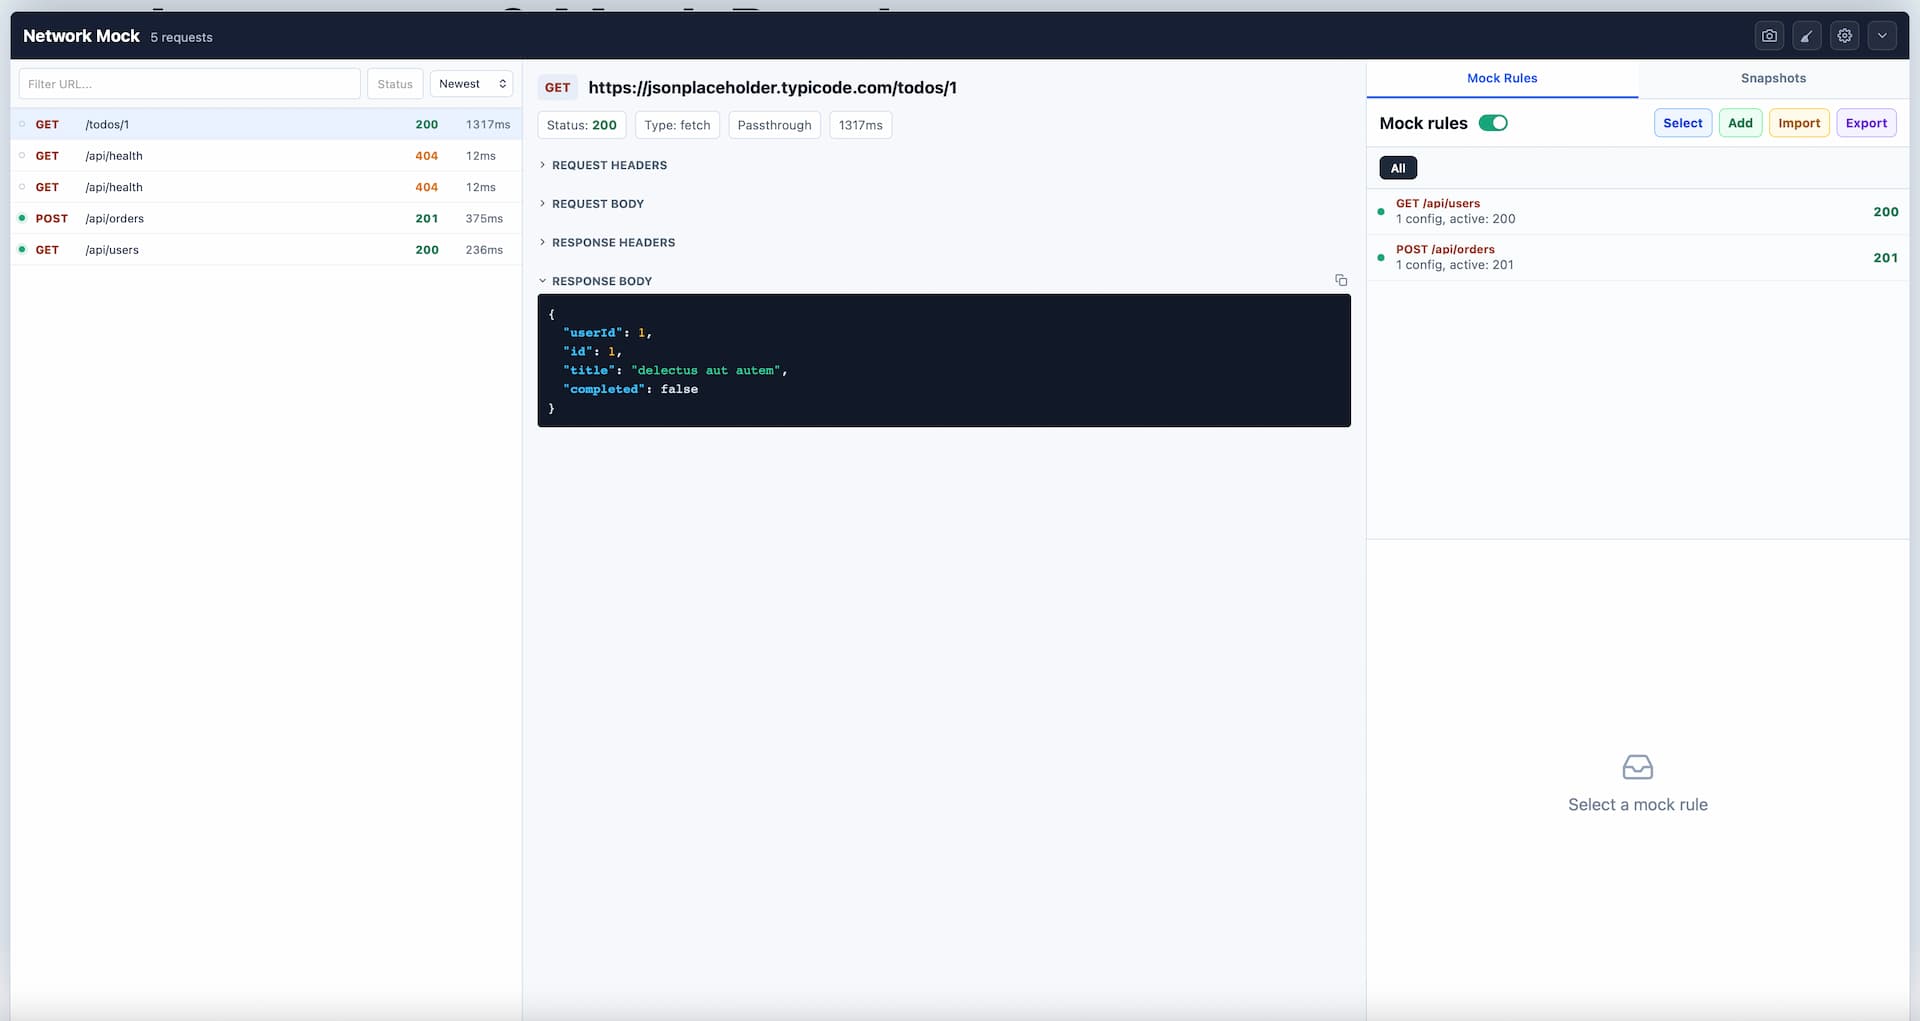 Request list and response details
At first, I only wanted a simplified Network panel so I would not have to scatter console.log calls throughout the application. The list is capped at 200 requests to prevent it from growing forever during a long debugging session.
Mock Rules
The Mock rule editor is on the right. A rule looks roughly like this:
1 | { |
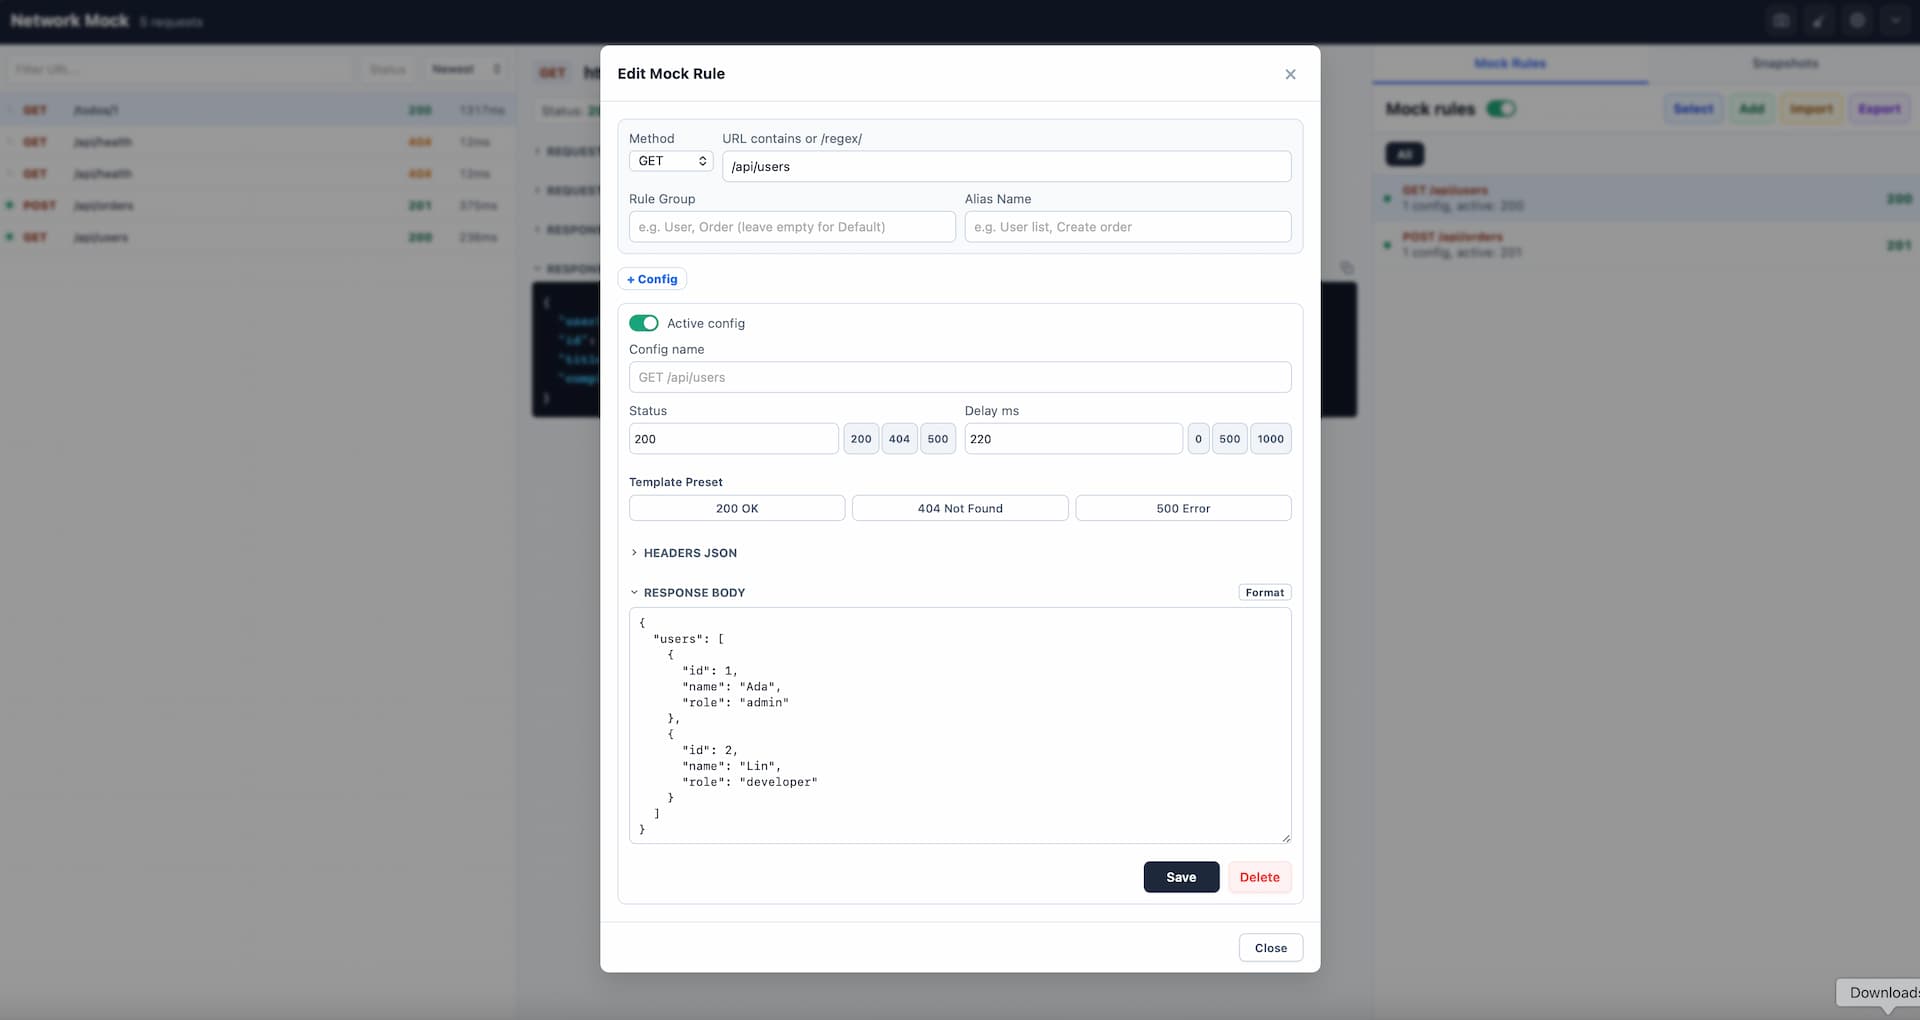 Mock rule list and editor
pattern currently supports two forms. A plain string:
1 | /api/users |
Or a simple regular expression:
1 | /\/api\/users\/\d+/ |
I deliberately kept it simple. The more complicated a rule is to write, the less obvious it becomes when something goes wrong. For most cases, checking whether a URL contains a string is enough.
One Rule can contain multiple Configs. More Configs can be added, but only one can be active at a time. After all, one endpoint cannot return two different responses at once.
Snapshots
Snapshots came later. A regular Mock works well when an endpoint should keep returning the same response.
But there is always a “but.” Here is a familiar situation:
Developer: What kind of bug is this? It is so hard to reproduce. Can I borrow your account?
QA: Sure, but give it back soon. I still need it for testing.
Developer: Yep, I will return it as soon as I check this bug.
QA: Do not change anything. It took me ages to prepare that data.
Developer: Got it, boss.
It is hard to imagine a developer, especially a front-end developer, who has never run into this. Take a task-status endpoint: the first response is pending; after a few clicks, the second is processing; after a few more, the third is done. A single static JSON file cannot reproduce that process very well.
A Snapshot can store a sequence of Responses and replay them in order. When it reaches the end, it can either keep returning the last response or loop back to the beginning.
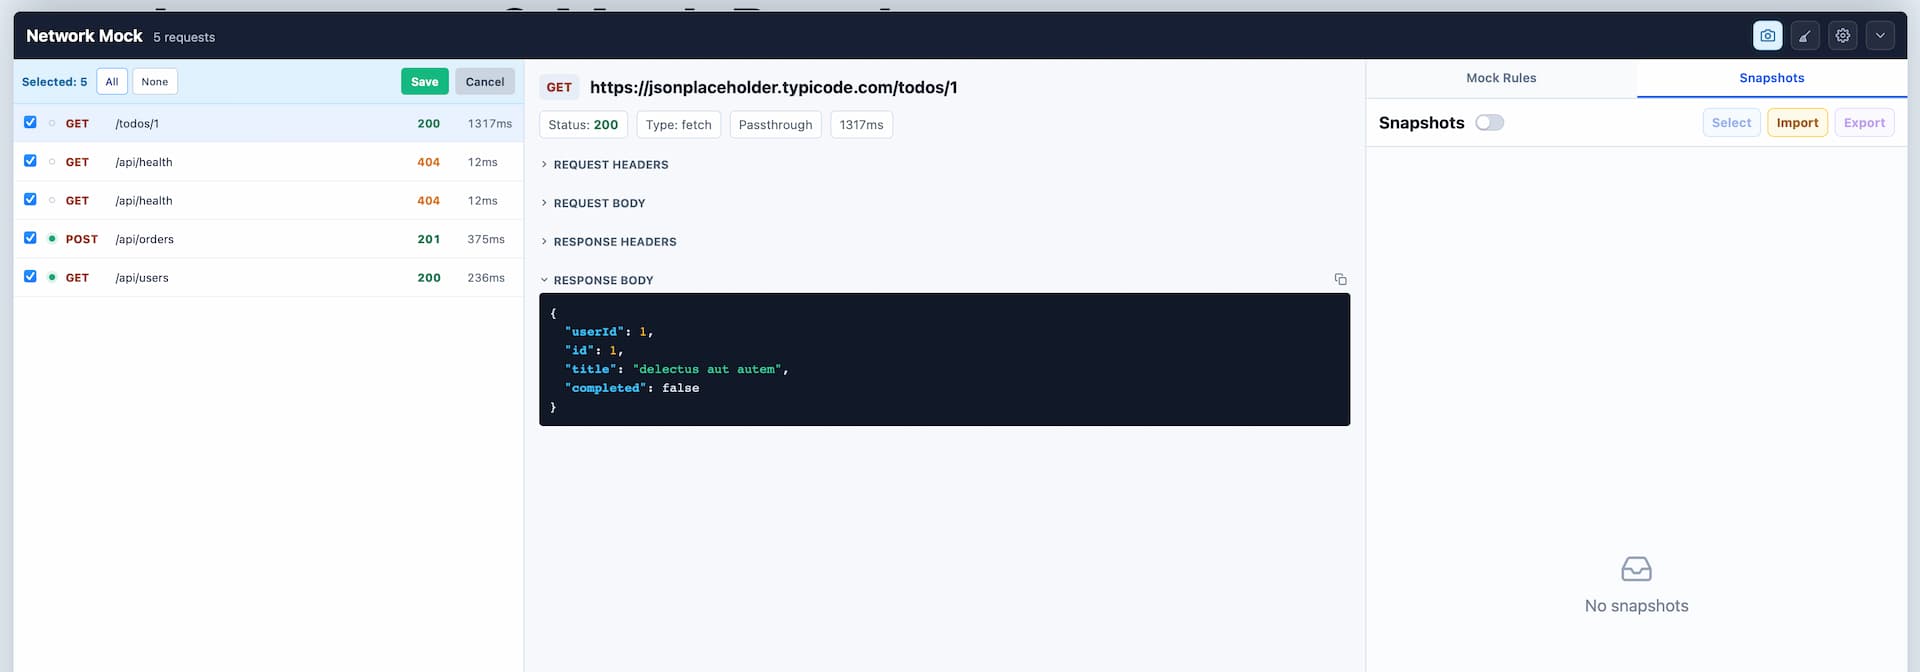 Selecting multiple responses and saving them as a Snapshot
This is useful for polling, pagination, state transitions, and similar flows.
Persistence
Mock rules should not disappear after a refresh, so the configuration is stored in IndexedDB first. If IndexedDB is unavailable, it falls back to localStorage. Data saved by older versions in localStorage is also migrated to IndexedDB during initialization. Import and export are included as well, because browser storage is not a backup. Clear the site’s data and it is gone. An exported JSON file can restore the configuration or be sent to someone else as a reproducible setup for a specific issue.
Why Introduce a Service Worker?
At first, JavaScript hooks were enough. To intercept fetch, the tool can replace window.fetch. To intercept XMLHttpRequest, it can wrap the original XHR object, override open, send, and setRequestHeader, then simulate readyState, status, responseText, and the relevant events when a rule matches. This approach is simple and also works with file://, so opening index.html directly is enough.
The problem is that these requests do not really pass through the browser’s network stack. The embedded panel can see them, but the browser’s native Network panel may not show a complete record. That is why I added a Service Worker.
On http://localhost or https, the tool attempts to register mocktools-sw.js. When a rule matches, the Service Worker returns the Mock Response from its fetch event, which also makes the request visible in the native Network panel.
Service Workers are not a universal solution, though.
- They cannot run on
file:// - They require a secure context, normally
httpsorlocalhost - After the first registration, the current page may not immediately be controlled
- Rules need to be synchronized between the page and the worker
The tool therefore keeps both approaches. When the Service Worker is available, it handles requests. Otherwise, the tool falls back to JavaScript hooks.
Difficult Parts
The tool does not have complicated dependencies, but it contains quite a few details.
A fetch Response Can Only Be Read Once
The body of a Response is a stream. If the interceptor reads the original response to display its content, the application may no longer be able to read it. For a real request, the tool must call response.clone(), read the cloned response for display, and return the original response to the application. This matters: a debugging tool should not change application behavior just because it wants to show the response body.
Simulating XHR Is More Complicated
XMLHttpRequest is more difficult than fetch. When a fetch rule matches, returning a new Response is enough. XHR has its own state machine and event model.
Application code may listen for:
readystatechangeloadloadend
It may also read:
statusstatusTextresponseresponseTextgetAllResponseHeaders()
So an XHR Mock cannot simply return a string. It also needs to reproduce those states and events.
Synchronizing Service Worker State
Mock rules are edited in the page panel, but the Service Worker may be the component that actually intercepts the request. Every rule change, global toggle, and Snapshot update must therefore be sent to the worker through postMessage. The worker may be installing, waiting, or active, or it may already be the page’s controller, so synchronization cannot target only one fixed object.
UI State
It started as a request list and a details view, but the number of states kept growing:
- Whether the panel is expanded or collapsed
- The selected request
- The selected Mock rule
- Request search and sorting
- Group tabs
- The Snapshot list, selected Snapshot, and editing draft
- The details-pane layout
- Storage status and error messages
- Whether the Service Worker is available
The tool is still written in plain JavaScript without React, Vue, or other dependencies. The upside is that it stays small and works by simply including a few files. The downside is that I have to keep the state management under control myself.
Persistence Fallbacks
IndexedDB is not always available. Private browsing, browser restrictions, and unusual environments can all cause reads or writes to fail. When that happens, the tool falls back to localStorage. If both fail, the current in-memory state should at least remain usable.
Where It Fits
I think it works particularly well for:
- Quickly debugging API-driven UI states
- Seeding a set of API responses for a UI demo
- Continuing interaction development without a complete back-end environment
- Giving QA or product managers a reproducible error state
- Lightweight debugging in static pages, embedded pages, WebViews, or third-party containers
- Exporting and sharing a particular Mock configuration
It is not meant to replace every Mock solution. If a project already has a mature Mock Server, API platform, or contract-testing setup, those are still the better choice. This is more like a small panel that is handy when needed and stays out of the way when it is not.
Closing
That is it for now. At least when I need to quickly change an API response or reproduce an unusual state, it already solves the problem for me.